
- 中国科学学与科技政策研究会
- 中国科学院科技战略咨询研究院
- 清华大学科学技术与社会研究中心
ISSN 1003-2053 CN 11-1805/G3
科学学研究 ›› 2026, Vol. 44 ›› Issue (9): 1899-1910.
赵雪琦1, 孙小哲2( ), 李纪珍1
收稿日期:2025-05-18
修回日期:2025-06-25
出版日期:2026-09-15
发布日期:2026-09-15
通讯作者:
孙小哲(1995-),男,助理研究员,博士,E-mail:作者简介:赵雪琦(1997-),女,博士后。基金资助:
ZHAO Xue-qi1, SUN Xiao-zhe2(), LI Ji-zhen1
Received:2025-05-18
Revised:2025-06-25
Online:2026-09-15
Published:2026-09-15
摘要:
在加快实现高水平科技自立自强的背景下,数据资产信息披露已成为企业构筑数字技术创新竞争优势的关键。本研究基于2012-2023年沪深A股上市企业数据,采用固定效应面板模型,实证检验数据资产信息披露对企业数字技术创新的作用影响。研究发现,数据资产信息披露推动促进企业数字技术创新的“量质双提升”。异质性分析表明,数据资产信息披露对制造企业创新质量的提升更为明显,非制造业企业则集中于创新数量的突破;自用型数据资产的信息披露效应相较于交易型数据资产更为显著;技术密集型企业创新质量的提升效应更为突出。中介效应和调节效应检验结果表明,企业技术交易网络地位提升是其中重要的中介途径;知识产权保护强化了数据资产信息披露对创新数量的促进作用,但对创新质量的调节效应不显著。本文研究为企业通过数据资产战略实现技术跃迁指明实施路径,为政府完善数据资产信息披露制度设计提供政策依据。
中图分类号:
赵雪琦, 孙小哲, 李纪珍. 数据资产信息披露对数字技术创新的影响研究[J]. 科学学研究, 2026, 44(9): 1899-1910.
ZHAO Xue-qi, SUN Xiao-zhe, LI Ji-zhen. The impact of data asset disclosure on digital technological innovation[J]. Studies in Science of Science, 2026, 44(9): 1899-1910.
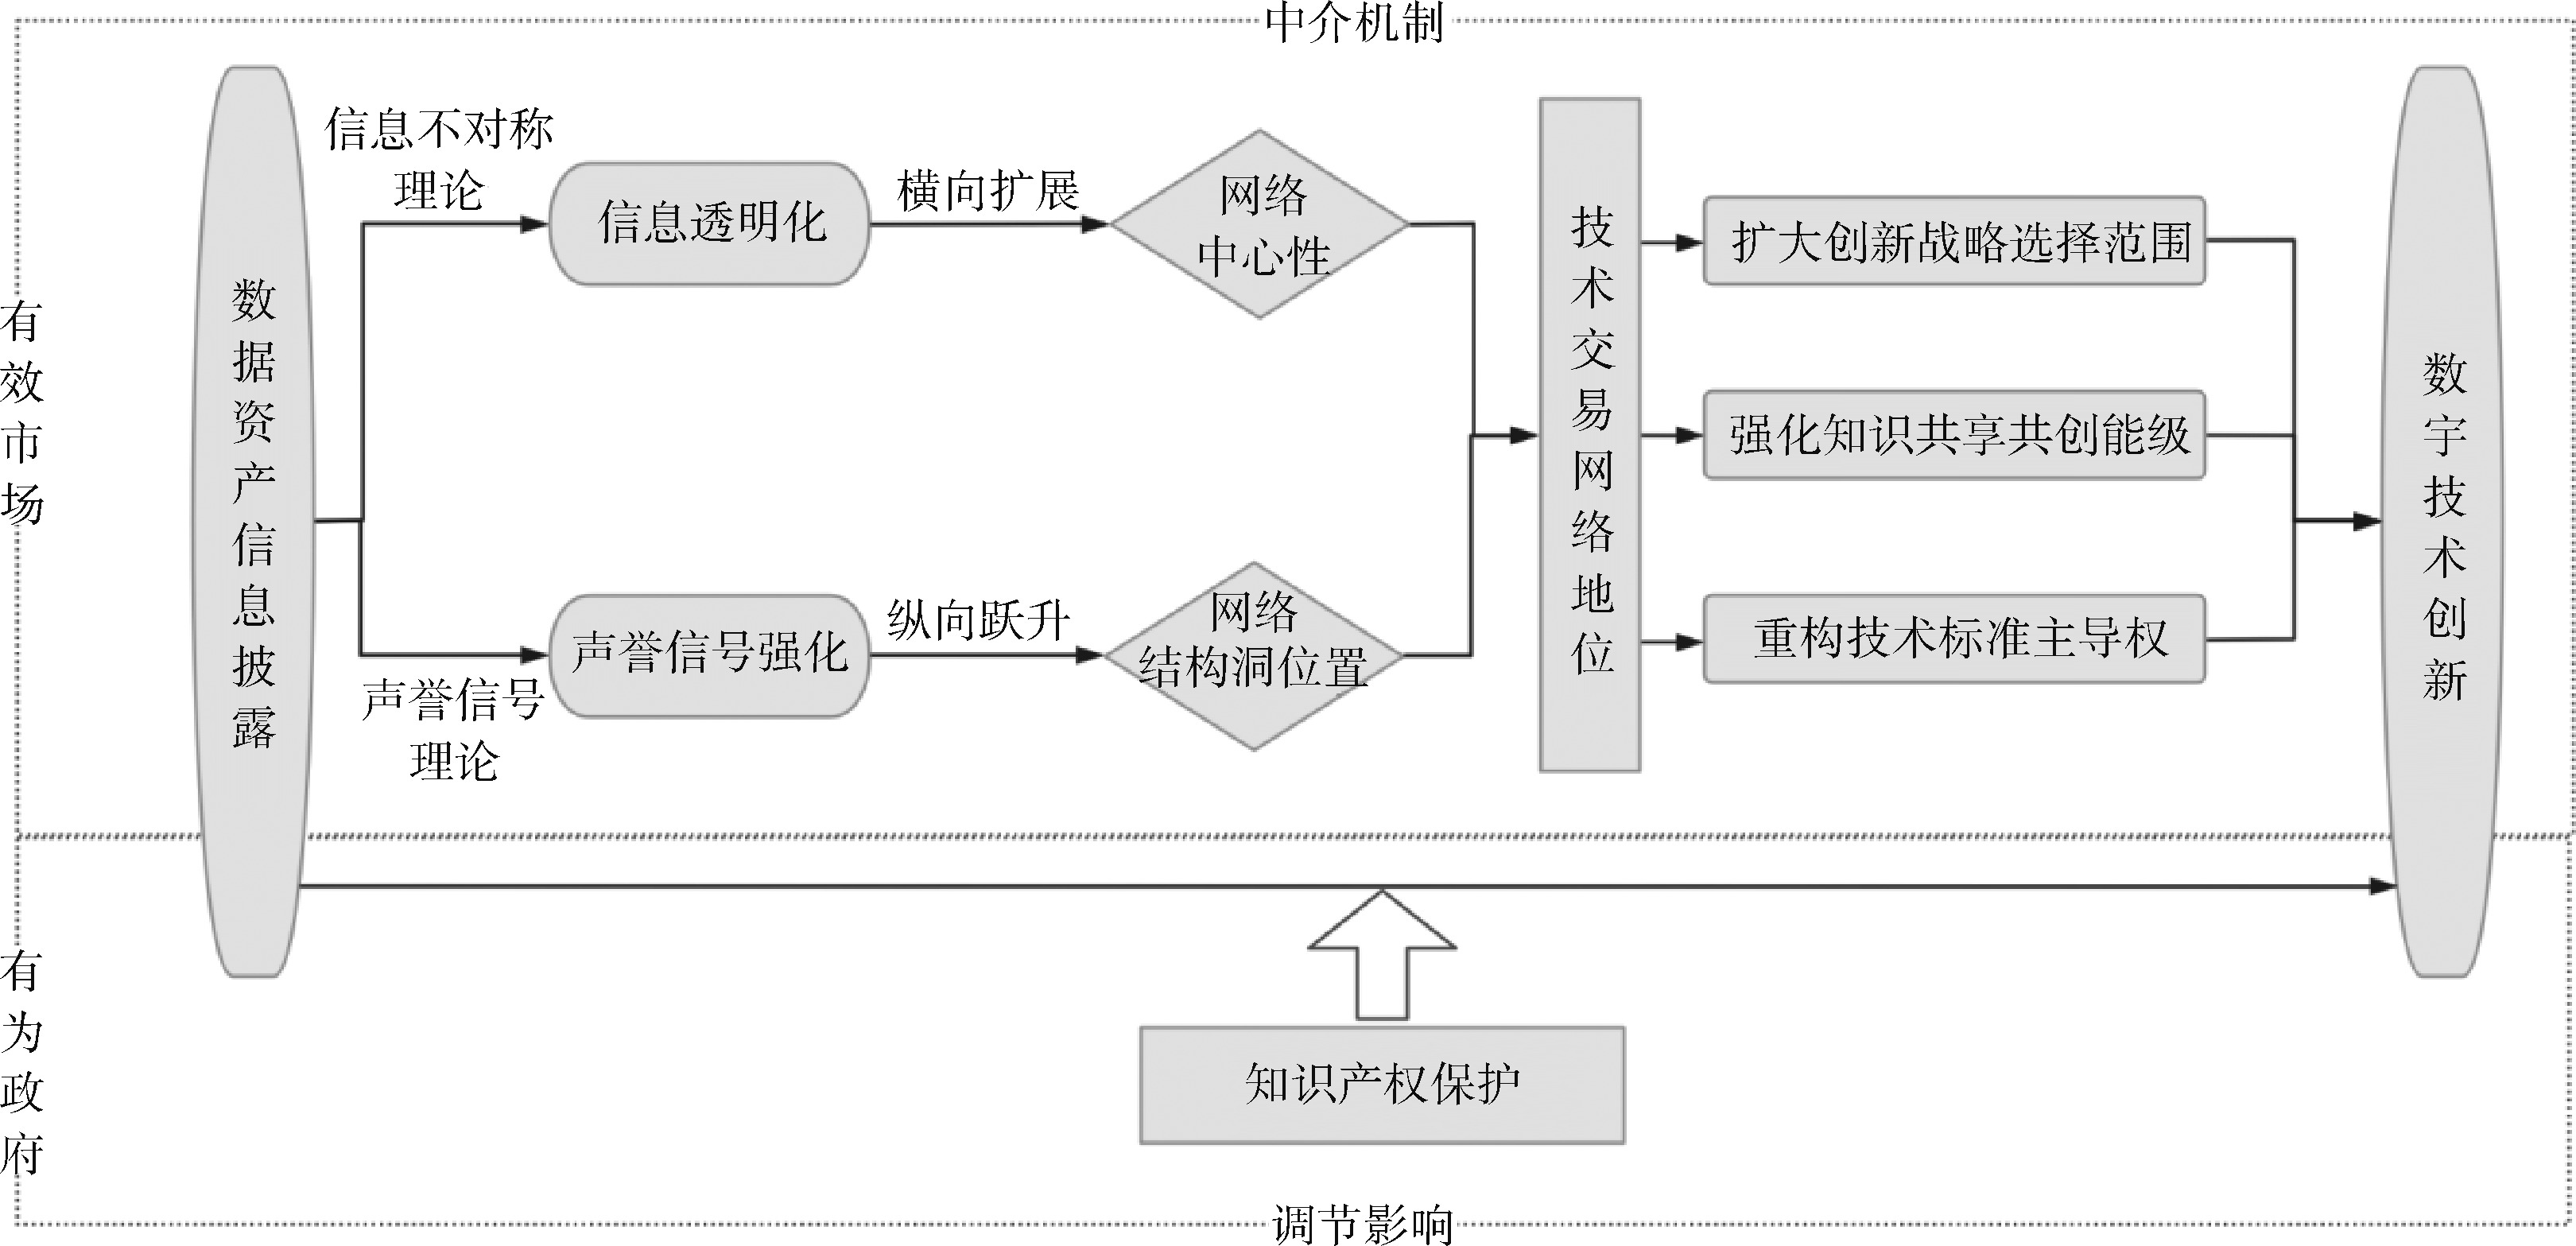
图1 数据资产信息披露对数字技术创新的逻辑机制框架
Figure 1 Logic mechanism framework of data asset information disclosure on digital technology innovation
| 变量类别 | 变量名称 | 计算方法 |
|---|---|---|
| 被解释变量 | 数字技术创新数量(Innovation1) | 数字发明专利申请数量加1取对数 |
| 数字技术创新质量(Innovation2) | 数字发明专利授权数量加1取对数 | |
| 核心解释变量 | 企业数据资产信息披露(DA) | 年报关于数据资产披露的词频统计加1取对数 |
| 控制变量 | 企业年龄(Age) | Ln(当年年份-上市年份+1) |
| 企业规模(Size) | Ln(营业收入) | |
| 总资产净利润率(Roa) | 净利润/平均总资产*100% | |
| 现金比率(CR) | 现金及现金等价物期末余额/流动负债 | |
| 资产负债率(Debt) | 负债总额/资产总额*100% | |
| 两职合一(Dual) | 董事长和CEO是否为同一人 | |
| 第一大股东持股比例(Top1) | 第一大股东持股占比 | |
| 审计意见(Audit) | 标准无保留意见1,否则为0 |
表1 主要变量描述与计算方法
Table 1 Description and measurement methods of main variables
| 变量类别 | 变量名称 | 计算方法 |
|---|---|---|
| 被解释变量 | 数字技术创新数量(Innovation1) | 数字发明专利申请数量加1取对数 |
| 数字技术创新质量(Innovation2) | 数字发明专利授权数量加1取对数 | |
| 核心解释变量 | 企业数据资产信息披露(DA) | 年报关于数据资产披露的词频统计加1取对数 |
| 控制变量 | 企业年龄(Age) | Ln(当年年份-上市年份+1) |
| 企业规模(Size) | Ln(营业收入) | |
| 总资产净利润率(Roa) | 净利润/平均总资产*100% | |
| 现金比率(CR) | 现金及现金等价物期末余额/流动负债 | |
| 资产负债率(Debt) | 负债总额/资产总额*100% | |
| 两职合一(Dual) | 董事长和CEO是否为同一人 | |
| 第一大股东持股比例(Top1) | 第一大股东持股占比 | |
| 审计意见(Audit) | 标准无保留意见1,否则为0 |
| 变量名称 | N | mean | p50 | min | max | sd |
|---|---|---|---|---|---|---|
| Innovation1 | 24000 | 1.299 | 1.099 | 0 | 5.635 | 1.315 |
| Innovation2 | 24000 | 0.814 | 0.693 | 0 | 4.787 | 1.089 |
| DA | 24000 | 3.390 | 3.296 | 1.792 | 5.855 | 0.754 |
| Age | 24000 | 1.831 | 1.946 | 0 | 3.526 | 0.918 |
| Size | 23000 | 21.49 | 21.27 | 11.60 | 28.83 | 1.552 |
| Roa | 24000 | 0.0354 | 0.0390 | -5.259 | 22.01 | 0.178 |
| CR | 23000 | 1.072 | 0.434 | 0 | 148.0 | 2.691 |
| Debt | 24000 | 0.425 | 0.406 | 0.00800 | 61.34 | 0.670 |
| Dual | 23000 | 0.324 | 0 | 0 | 1 | 0.468 |
| Top1 | 24000 | 33.80 | 31.26 | 0.290 | 89.99 | 15.17 |
| Audit | 24000 | 0.911 | 1 | 0 | 1 | 0.284 |
表2 变量描述性统计
Table 2 Descriptive statistics of variables
| 变量名称 | N | mean | p50 | min | max | sd |
|---|---|---|---|---|---|---|
| Innovation1 | 24000 | 1.299 | 1.099 | 0 | 5.635 | 1.315 |
| Innovation2 | 24000 | 0.814 | 0.693 | 0 | 4.787 | 1.089 |
| DA | 24000 | 3.390 | 3.296 | 1.792 | 5.855 | 0.754 |
| Age | 24000 | 1.831 | 1.946 | 0 | 3.526 | 0.918 |
| Size | 23000 | 21.49 | 21.27 | 11.60 | 28.83 | 1.552 |
| Roa | 24000 | 0.0354 | 0.0390 | -5.259 | 22.01 | 0.178 |
| CR | 23000 | 1.072 | 0.434 | 0 | 148.0 | 2.691 |
| Debt | 24000 | 0.425 | 0.406 | 0.00800 | 61.34 | 0.670 |
| Dual | 23000 | 0.324 | 0 | 0 | 1 | 0.468 |
| Top1 | 24000 | 33.80 | 31.26 | 0.290 | 89.99 | 15.17 |
| Audit | 24000 | 0.911 | 1 | 0 | 1 | 0.284 |
| 变量 | (1) | (2) | (3) | (4) |
|---|---|---|---|---|
| Innovation1 | Innovation2 | Innovation1 | Innovation2 | |
| DA | 0.0691** | 0.0911*** | 0.0606** | 0.0800*** |
| (2.3205) | (3.4673) | (2.0693) | (3.0331) | |
| Age | -0.0462 | 0.0040 | ||
| (-1.5164) | (0.1563) | |||
| Size | 0.1549*** | 0.0729*** | ||
| (6.2789) | (3.8159) | |||
| Roa | 0.1425 | -0.2526*** | ||
| (1.2461) | (-3.6501) | |||
| CR | -0.0011 | -0.0101*** | ||
| (-0.4003) | (-2.6011) | |||
| Debt | -0.1269* | -0.0439 | ||
| (-1.7042) | (-0.8964) | |||
| Dual | 0.0139 | 0.0086 | ||
| (0.5170) | (0.3560) | |||
| Top1 | 0.0033* | 0.0020 | ||
| (1.7562) | (1.3023) | |||
| Audit | 0.0846*** | -0.0182 | ||
| (2.7454) | (-0.6410) | |||
| Constant | 1.1186*** | 0.5673*** | -2.2445*** | -0.9871** |
| (10.9628) | (6.2984) | (-4.1678) | (-2.3775) | |
| FirmFE | YES | YES | YES | YES |
| YearFE | YES | YES | YES | YES |
| N | 18,680 | 18,680 | 18,680 | 18,680 |
| R2 | 0.7093 | 0.7157 | 0.7127 | 0.7168 |
表3 基准回归结果
Table 3 Baseline regression results
| 变量 | (1) | (2) | (3) | (4) |
|---|---|---|---|---|
| Innovation1 | Innovation2 | Innovation1 | Innovation2 | |
| DA | 0.0691** | 0.0911*** | 0.0606** | 0.0800*** |
| (2.3205) | (3.4673) | (2.0693) | (3.0331) | |
| Age | -0.0462 | 0.0040 | ||
| (-1.5164) | (0.1563) | |||
| Size | 0.1549*** | 0.0729*** | ||
| (6.2789) | (3.8159) | |||
| Roa | 0.1425 | -0.2526*** | ||
| (1.2461) | (-3.6501) | |||
| CR | -0.0011 | -0.0101*** | ||
| (-0.4003) | (-2.6011) | |||
| Debt | -0.1269* | -0.0439 | ||
| (-1.7042) | (-0.8964) | |||
| Dual | 0.0139 | 0.0086 | ||
| (0.5170) | (0.3560) | |||
| Top1 | 0.0033* | 0.0020 | ||
| (1.7562) | (1.3023) | |||
| Audit | 0.0846*** | -0.0182 | ||
| (2.7454) | (-0.6410) | |||
| Constant | 1.1186*** | 0.5673*** | -2.2445*** | -0.9871** |
| (10.9628) | (6.2984) | (-4.1678) | (-2.3775) | |
| FirmFE | YES | YES | YES | YES |
| YearFE | YES | YES | YES | YES |
| N | 18,680 | 18,680 | 18,680 | 18,680 |
| R2 | 0.7093 | 0.7157 | 0.7127 | 0.7168 |
| 变量 | (1) Innovation1 | (2) Innovation2 | (3) Innovation1 | (4) Innovation2 | (5) Innovation1 | (6) Innovation2 |
|---|---|---|---|---|---|---|
| DA | 0.0204* | 0.0271** | 0.0552* | 0.0680** | 0.0552* | 0.1012*** |
| (1.9212) | (2.4621) | (1.7016) | (2.2815) | (1.6763) | (3.5465) | |
| 控制变量 | YES | YES | YES | YES | YES | YES |
| Constant | -0.1156 | 0.4052** | -2.5232*** | -1.1408** | -2.3743*** | -0.7067* |
| (-0.7165) | (2.4255) | (-4.4340) | (-2.4715) | (-4.1907) | (-1.6862) | |
| FirmFE | YES | YES | YES | YES | YES | YES |
| YearFE | YES | YES | YES | YES | YES | YES |
| N | 18,680 | 18,680 | 15,025 | 15,025 | 14,810 | 14,810 |
| R2 | 0.3217 | 0.3931 | 0.7187 | 0.7068 | 0.7409 | 0.7525 |
表4 替换变量与更换样本回归结果
Table 4 Variable replacement and sample alteration regression results
| 变量 | (1) Innovation1 | (2) Innovation2 | (3) Innovation1 | (4) Innovation2 | (5) Innovation1 | (6) Innovation2 |
|---|---|---|---|---|---|---|
| DA | 0.0204* | 0.0271** | 0.0552* | 0.0680** | 0.0552* | 0.1012*** |
| (1.9212) | (2.4621) | (1.7016) | (2.2815) | (1.6763) | (3.5465) | |
| 控制变量 | YES | YES | YES | YES | YES | YES |
| Constant | -0.1156 | 0.4052** | -2.5232*** | -1.1408** | -2.3743*** | -0.7067* |
| (-0.7165) | (2.4255) | (-4.4340) | (-2.4715) | (-4.1907) | (-1.6862) | |
| FirmFE | YES | YES | YES | YES | YES | YES |
| YearFE | YES | YES | YES | YES | YES | YES |
| N | 18,680 | 18,680 | 15,025 | 15,025 | 14,810 | 14,810 |
| R2 | 0.3217 | 0.3931 | 0.7187 | 0.7068 | 0.7409 | 0.7525 |
| 变量 | (1) | (2) | (3) |
|---|---|---|---|
| DA | Innovation 1 | Innovation 2 | |
| DA | 0.5484*** | 0.4594*** | |
| (3.5836) | (3.6017) | ||
| IV | 0.2407*** | ||
| (7.1818) | |||
| 控制变量 | YES | YES | YES |
| FirmFE | YES | YES | YES |
| YearFE | YES | YES | YES |
| N | 17,949 | 17,949 | 17,949 |
| K.P. LM statistic | 342.720 | 342.720 | |
| C.D. Wald F statistic | 290.741 | 290.741 |
表5 工具变量回归结果
Table 5 Instrumental variable regression results
| 变量 | (1) | (2) | (3) |
|---|---|---|---|
| DA | Innovation 1 | Innovation 2 | |
| DA | 0.5484*** | 0.4594*** | |
| (3.5836) | (3.6017) | ||
| IV | 0.2407*** | ||
| (7.1818) | |||
| 控制变量 | YES | YES | YES |
| FirmFE | YES | YES | YES |
| YearFE | YES | YES | YES |
| N | 17,949 | 17,949 | 17,949 |
| K.P. LM statistic | 342.720 | 342.720 | |
| C.D. Wald F statistic | 290.741 | 290.741 |
| 变量 | (1)Innovation1 | (2)Innovation2 | (3)Innovation1 | (4)Innovation2 |
|---|---|---|---|---|
| 制造业 | 制造业 | 非制造业 | 非制造业 | |
| DA | 0.0371 | 0.0790*** | 0.1412** | 0.0765 |
| (1.1507) | (2.6204) | (2.2569) | (1.4213) | |
| 控制变量 | YES | YES | YES | YES |
| Constant | -2.6791*** | -1.3909*** | -3.7443*** | -1.3437* |
| (-4.0307) | (-2.7017) | (-3.7554) | (-1.8345) | |
| FirmFE | YES | YES | YES | YES |
| YearFE | YES | YES | YES | YES |
| N | 14,348 | 14,348 | 4,246 | 4,246 |
| R2 | 0.7223 | 0.7189 | 0.6986 | 0.7226 |
表6 披露行业的异质性检验结果
Table 6 Heterogeneity test results by disclosure industry type
| 变量 | (1)Innovation1 | (2)Innovation2 | (3)Innovation1 | (4)Innovation2 |
|---|---|---|---|---|
| 制造业 | 制造业 | 非制造业 | 非制造业 | |
| DA | 0.0371 | 0.0790*** | 0.1412** | 0.0765 |
| (1.1507) | (2.6204) | (2.2569) | (1.4213) | |
| 控制变量 | YES | YES | YES | YES |
| Constant | -2.6791*** | -1.3909*** | -3.7443*** | -1.3437* |
| (-4.0307) | (-2.7017) | (-3.7554) | (-1.8345) | |
| FirmFE | YES | YES | YES | YES |
| YearFE | YES | YES | YES | YES |
| N | 14,348 | 14,348 | 4,246 | 4,246 |
| R2 | 0.7223 | 0.7189 | 0.6986 | 0.7226 |
| 变量 | (1)Innovation1 | (2)Innovation2 | (3)Innovation1 | (4)Innovation2 |
|---|---|---|---|---|
| 自用型 | 自用型 | 交易型 | 交易型 | |
| DA | 0.0666** | 0.0887*** | 0.0159 | 0.0197 |
| (2.2442) | (3.3251) | (0.9312) | (1.3179) | |
| 控制变量 | YES | YES | YES | YES |
| Constant | -2.2601*** | -1.0097** | -2.0883*** | -0.7814* |
| (-4.1878) | (-2.4301) | (-3.9337) | (-1.9141) | |
| FirmFE | YES | YES | YES | YES |
| YearFE | YES | YES | YES | YES |
| N | 18,680 | 18,680 | 18,680 | 18,680 |
| R2 | 0.7127 | 0.7169 | 0.7126 | 0.7164 |
表7 数据披露的异质性检验结果
Table 7 Heterogeneity test results by disclosure approach
| 变量 | (1)Innovation1 | (2)Innovation2 | (3)Innovation1 | (4)Innovation2 |
|---|---|---|---|---|
| 自用型 | 自用型 | 交易型 | 交易型 | |
| DA | 0.0666** | 0.0887*** | 0.0159 | 0.0197 |
| (2.2442) | (3.3251) | (0.9312) | (1.3179) | |
| 控制变量 | YES | YES | YES | YES |
| Constant | -2.2601*** | -1.0097** | -2.0883*** | -0.7814* |
| (-4.1878) | (-2.4301) | (-3.9337) | (-1.9141) | |
| FirmFE | YES | YES | YES | YES |
| YearFE | YES | YES | YES | YES |
| N | 18,680 | 18,680 | 18,680 | 18,680 |
| R2 | 0.7127 | 0.7169 | 0.7126 | 0.7164 |
| 变量 | (1)Innovation1 | (2)Innovation2 | (3)Innovation1 | (4)Innovation2 |
|---|---|---|---|---|
| 技术密集型 | 技术密集型 | 非技术密集型 | 非技术密集型 | |
| DA | 0.0599 | 0.0991*** | 0.0441 | 0.0593 |
| (1.5669) | (2.8775) | (0.7502) | (1.2142) | |
| 控制变量 | YES | YES | YES | YES |
| Constant | -3.1415*** | -1.2550** | -1.3530 | -1.5679 |
| (-4.4026) | (-2.3380) | (-1.2327) | (-1.6300) | |
| FirmFE | YES | YES | YES | YES |
| YearFE | YES | YES | YES | YES |
| N | 12,577 | 12,577 | 3,329 | 3,329 |
| R2 | 0.7212 | 0.7190 | 0.6638 | 0.6746 |
表8 要素密集的异质性检验结果
Table 8 Heterogeneity test results by factor intensity
| 变量 | (1)Innovation1 | (2)Innovation2 | (3)Innovation1 | (4)Innovation2 |
|---|---|---|---|---|
| 技术密集型 | 技术密集型 | 非技术密集型 | 非技术密集型 | |
| DA | 0.0599 | 0.0991*** | 0.0441 | 0.0593 |
| (1.5669) | (2.8775) | (0.7502) | (1.2142) | |
| 控制变量 | YES | YES | YES | YES |
| Constant | -3.1415*** | -1.2550** | -1.3530 | -1.5679 |
| (-4.4026) | (-2.3380) | (-1.2327) | (-1.6300) | |
| FirmFE | YES | YES | YES | YES |
| YearFE | YES | YES | YES | YES |
| N | 12,577 | 12,577 | 3,329 | 3,329 |
| R2 | 0.7212 | 0.7190 | 0.6638 | 0.6746 |
| 变量 | (1) | (2) | (3) | (4) | (5) |
|---|---|---|---|---|---|
| DC | Innovation1 | Innovation1 | Innovation2 | Innovation2 | |
| DA | 0.0521*** | ||||
| (3.0827) | |||||
| DC | 0.0286** | 0.0201* | |||
| (2.0329) | (1.7316) | ||||
| $\overline{DC}$ | 1.1648** | 1.5372*** | |||
| (2.0693) | (3.0331) | ||||
| 控制变量 | YES | YES | YES | YES | YES |
| Constant | -1.5779*** | -2.0530*** | -0.4067 | -0.7598* | 1.4384* |
| (-5.8064) | (-3.8763) | (-0.4251) | (-1.8616) | (1.7327) | |
| FirmFE | YES | YES | YES | YES | YES |
| YearFE | YES | YES | YES | YES | YES |
| N | 18,680 | 18,680 | 18,680 | 18,680 | 18,680 |
| R2 | 0.3934 | 0.7126 | 0.7127 | 0.7165 | 0.7168 |
表9 中介效应检验结果
Table 9 Mediating effect test results
| 变量 | (1) | (2) | (3) | (4) | (5) |
|---|---|---|---|---|---|
| DC | Innovation1 | Innovation1 | Innovation2 | Innovation2 | |
| DA | 0.0521*** | ||||
| (3.0827) | |||||
| DC | 0.0286** | 0.0201* | |||
| (2.0329) | (1.7316) | ||||
| $\overline{DC}$ | 1.1648** | 1.5372*** | |||
| (2.0693) | (3.0331) | ||||
| 控制变量 | YES | YES | YES | YES | YES |
| Constant | -1.5779*** | -2.0530*** | -0.4067 | -0.7598* | 1.4384* |
| (-5.8064) | (-3.8763) | (-0.4251) | (-1.8616) | (1.7327) | |
| FirmFE | YES | YES | YES | YES | YES |
| YearFE | YES | YES | YES | YES | YES |
| N | 18,680 | 18,680 | 18,680 | 18,680 | 18,680 |
| R2 | 0.3934 | 0.7126 | 0.7127 | 0.7165 | 0.7168 |
| 变量 | (1) Innovation1 | (2) Innovation2 |
|---|---|---|
| DA | 0.0335 | 0.0815*** |
| (1.0329) | (2.9164) | |
| IPP*DA | 0.0209** | -0.0012 |
| (2.1715) | (-0.1188) | |
| IPP | -0.0725** | 0.0018 |
| (-2.2897) | (0.0564) | |
| 控制变量 | YES | YES |
| Constant | -2.1346*** | -0.9892** |
| (-3.9525) | (-2.3816) | |
| FirmFE | YES | YES |
| YearFE | YES | YES |
| N | 18,680 | 18,680 |
| R2 | 0.7128 | 0.7167 |
表10 调节效应检验结果
Table 10 Moderating effect test results
| 变量 | (1) Innovation1 | (2) Innovation2 |
|---|---|---|
| DA | 0.0335 | 0.0815*** |
| (1.0329) | (2.9164) | |
| IPP*DA | 0.0209** | -0.0012 |
| (2.1715) | (-0.1188) | |
| IPP | -0.0725** | 0.0018 |
| (-2.2897) | (0.0564) | |
| 控制变量 | YES | YES |
| Constant | -2.1346*** | -0.9892** |
| (-3.9525) | (-2.3816) | |
| FirmFE | YES | YES |
| YearFE | YES | YES |
| N | 18,680 | 18,680 |
| R2 | 0.7128 | 0.7167 |
| [1] | 李婉红, 王帆. 数字创新、战略柔性与企业智能化转型——考虑环境复杂性的调节效应[J]. 科学学研究, 2023, 41(3): 521-533. |
| Li W H, Wang F. Digital innovation, strategic flexibility and enterprise intelligent transformation: Based on the moderating effect of environmental complexity[J]. Studies in Science of Science, 2023, 41(3):521-533. | |
| [2] | 程中华, 王兰, 李廉水. 数字规制对企业数字创新的影响研究[J]. 科学学研究, 2026, 44(3):632-643. |
| Cheng Z H, Wang L, Li L S. Research on the impact of digital regulation on corporate digital innovation[J]. Studies in Science of Science, 2026, 44(3):632-643. | |
| [3] | 黄勃, 李海彤, 刘俊岐, 等. 数字技术创新与中国企业高质量发展——来自企业数字专利的证据[J]. 经济研究, 2023, 58(3): 97-115. |
| Huang B, Li H T, Liu J Q, et al. Digital technology innovation and high-quality development of chinese enterprises: Evidence from enterprise's digital patents[J]. Economic Research Journal, 2023, 58(3):97-115. | |
| [4] | 王艳, 杨达. 中国式管理会计体系变革:从数据要素到数据资产[J]. 管理世界, 2024, 40(10): 171-189. |
| Wang Y, Yang D. China's unique path to management accounting system change:Transforming data elements into data assets[J]. Journal of Management World, 2024, 40(10):171-189. | |
| [5] | 金骋路, 陈荣达. 数据要素价值化及其衍生的金融属性:形成逻辑与未来挑战[J]. 数量经济技术经济研究, 2022, 39(7): 69-89. |
| Jin C L, Chen R D. Data valuations and its derived financial attributes: Formation logicand future challenges[J]. Journal of Quantitative & Technological Economics, 2022, 39(7):69-89. | |
| [6] |
Khurana I K, Martin X, Pereira R. Financial development and the cash flow sensitivity of cash[J]. Journal of Financial and Quantitative Analysis, 2006, 41(4):787-807.
DOI URL |
| [7] | 苑泽明, 于翔, 李萌. 数据资产信息披露、机构投资者异质性与企业价值[J]. 现代财经(天津财经大学学报), 2022, 42(11): 32-47. |
| Yuan Z M, Yu X, Li M. Data asset information disclosure, institutional investor heterogeneity and enterprise value[J]. Modern Finance and Economics-Journal of Tianjin University of Finance and Economics, 2022, 42(11):32-47. | |
| [8] | 何瑛, 陈丽丽, 杜亚光. 数据资产化能否缓解“专精特新”中小企业融资约束[J]. 中国工业经济, 2024(8): 154-173. |
| He Y, Chen L L, Du Y G. Does data assetization alleviate financing constraints of SRDI SMEs[J]. China Industrial Economics, 2024(8):154-173. | |
| [9] | 王翌秋, 谢萌. ESG信息披露对企业融资成本的影响——基于中国A股上市公司的经验证据[J]. 南开经济研究, 2022 (11): 75-94. |
| Wang Y Q, Xie M. The impact of ESG information disclosure on corporate financing costs:Based on the empirical evidence of listed companies in China[J]. Nankai Economic Studies, 2022(11):75-94. | |
| [10] | 程新生, 谭有超, 刘建梅. 非财务信息、外部融资与投资效率——基于外部制度约束的研究[J]. 管理世界, 2012 (7): 137-150. |
| Cheng X S, Tan Y C, Liu J M. The non-financial information, the external financing, and the investment efficiency: A study based on the constraint of external systems[J]. Journal of Management World, 2012(7):137-150. | |
| [11] |
Brown J R, Martinsson G. Does transparency stifle or facilitate innovation?[J]. Management Science, 2018, 65(4):1-24.
DOI URL |
| [12] | 方红星, 楚有为. 自愿披露、强制披露与资本市场定价效率[J]. 经济管理, 2019, 41(1): 156-173. |
| Fang H X, Chu Y W. Voluntary disclosure, compulsory disclosure and capital market pricing efficiency[J]. Business and Management Journal, 2019, 41(1):156-173. | |
| [13] | 李青原, 李昱, 章尹赛楠, 等. 企业数字化转型的信息溢出效应——基于供应链视角的经验证据[J]. 中国工业经济, 2023(7): 142-159. |
| Li Q Y, Li Y, Zhang Y S N, et al. Information spillover of enterprise digital transformation:Evidence from supply chain[J]. China Industrial Economics, 2023(7):142-159. | |
| [14] |
Wang Y, Kung L A, Byrd T A. Big data analytics: Understanding its capabilities and potential benefits for healthcare organizations[J]. Technological Forecasting and Social Change, 2018, 126(3):138-146.
DOI URL |
| [15] | 李政, 越婷婷, 贾妍妍. 地区大数据发展如何影响企业数字化转型?[J]. 现代财经(天津财经大学学报), 2023, 43(11): 61-76. |
| Li Z, Yue T T, Jia Y Y. How does the development of regional big data affect the digital transformation of enterprises?[J]. Modern Finance and Economics-Journal of Tianjin University of Finance and Economics, 2023, 43(11):61-76. | |
| [16] | 张俊瑞, 危雁麟, 尹兴强, 等. 企业数据资源信息披露影响审计收费吗?——基于文本分析的经验证据[J]. 审计研究, 2023(3): 60-71. |
| Zhang J R, Wei Y L, Yin X Q, et al. Does data resource information disclosure affect audit fees? Empirical evidence based on text analysis[J]. Auditing Research, 2023(3):60-71. | |
| [17] | 戴魁早. 技术市场发展对出口技术复杂度的影响及其作用机制[J]. 中国工业经济, 2018 (7): 117-135. |
| Dai K Z. The impact of the development of technology market on the export technical sophistication and its mechanism[J]. China Industrial Economics, 2018(7):117-135. | |
| [18] | 焦豪, 杨季枫, 王培暖, 等. 数据驱动的企业动态能力作用机制研究——基于数据全生命周期管理的数字化转型过程分析[J]. 中国工业经济, 2021(11): 174-192. |
| Jiao H, Yang J F, Wang P N, et al. Research on data-driven operation mechanism of dynamic capabilities: Based on analysis of digital transformation process from the data lifecycle management[J]. China Industrial Economics, 2021(11):174-192. | |
| [19] | 钱锡红, 杨永福, 徐万里. 企业网络位置、吸收能力与创新绩效——一个交互效应模型[J]. 管理世界, 2010 (5): 118-129. |
| Qian X H, Yang Y F, Xu W L. Enterprise network position, absorptive capacity and innovation performance: An interactive effect model[J]. Journal of Management World, 2010(5):118-129. | |
| [20] | Hewitt-Dundas N, Gkypali A, Roper S. Does learning from prior collaboration help firms to overcome the 'two-worlds' paradox in university-business collaboration?[J]. Research Policy, 2019,48. |
| [21] | 张振刚, 叶宝升, 户安涛, 等. 制造企业如何整合数据资源赋能产品创新绩效?——组织间计算型与关系型信任的作用[J]. 科学学研究, 2024, 42(3): 649-659. |
| Zhang Z G, Ye B S, Hu A T, et al. How do manufacturing enterprises integrate data resources to enable product innovation performance? The role of calculative and relationalinter-organizational trust[J]. Studies in Science of Science, 2024, 42(3):649-659. | |
| [22] | 郑曼妮, 黎文靖, 谭有超. 技术转移与企业高质量创新[J]. 世界经济, 2024, 47(3): 66-93. |
| Zheng M N, Li W J, Tan Y C. Technology transfer and corporate high-quality innovation[J]. The Journal of World Economy, 2024, 47(3):66-93. | |
| [23] | 陈荣达, 林祺, 金骋路, 等. 数据资产估值定价与新质生产力发展:演进逻辑与主要挑战[J]. 财贸经济, 2024, 45(8): 33-51. |
| Chen R D, Lin Q, Jin C L, et al. Data asset valuation and pricing and the development of new quality productive forces: Evolutionary logic and main challenges[J]. Finance & Trade Economics, 2024, 45(8):33-51. | |
| [24] | 郭丰, 任毅, 段云桂, 等. 知识产权保护对企业数字技术创新的影响效应研究——来自中国上市公司的证据[J/OL]. 管理评论. |
| Guo F, Ren Y, Duan Y G, et al. Research on the effect of intellectual property protection on enterprise digital technology innovation: Evidence from chinese listed companies[J/OL]. Management Review. | |
| [25] | 廖杨月, 余传鹏, 林春培. 数字创新韧性:概念、测量与演化模式识别——基于中国制造业上市企业的分析[J]. 科学学研究, 2025, 43(8):1676-1686. |
| Liao Y Y, Yu C P, Lin C P. Digital innovation resilience: Concepts, measurements, and evolution mode recognition:Based on the analysis of listed manufacturing enterprises in china[J]. Studies in Science of Science, 2025, 43(8):1676-1686. | |
| [26] | Sun X, Huang Q, Zhang H, et al. Comprehensive pilot zones for cross-border e-commerce propel the digital transformation of manufacturing enterprises: New evidence from China[J]. Electronic Commerce Research, 2024. |
| [27] | 李健, 张金林, 董小凡. 数字经济如何影响企业创新能力:内在机制与经验证据[J]. 经济管理, 2022, 44(8): 5-22. |
| Li J, Zhang J L, Dong X F. How digital economy affects enterprise innovation ability: Internal mechanism and empirical evidence[J]. Business and Management Journal, 2022, 44(8):5-22. | |
| [28] | 许和连, 王伦, 邓玉萍. 技术交易网络与出口企业成本加成——基于中国专利转让与许可的经验研究[J]. 中国工业经济, 2024 (4): 76-94. |
| Xu H L, Wang L, Deng Y P. Technology trading network and markup for export firms: Evidence from china's patent transfer and licensing[J]. China Industrial Economics, 2024(4):76-94. | |
| [29] |
Deng B, Li Z, Li Y. Foreign institutional ownership and liquidity commonality around the world[J]. Journal of Corporate Finance, 2018, 51:20-49.
DOI URL |
| [30] | 沈国兵, 黄铄珺. 城市层面知识产权保护对中国企业引进外资的影响[J]. 财贸经济, 2019, 40(12): 143-157. |
| Shen G B, Huang S J. The impact of city-level intellectual property protection on foreign capital entry into chinese enterprises[J]. Finance & Trade Economics, 2019, 40(12):143-157. |
| [1] | 张古鹏 梁艳 黄杜鹃 高波. 政府混合激励政策如何影响多元数字技术创新[J]. 科学学研究, 2026, 44(4): 842-858. |
| [2] | 吴先明 黄春桃 张亭. 后发国家研发投入的影响因素分析——知识产权保护的调节作用[J]. 科学学研究, 2016, 34(4): 503-511. |
| [3] | 马凌远. 知识产权保护与我国的服务贸易进口增长[J]. 科学学研究, 2014, 32(3): 366-373. |
| [4] | 孙赫. 知识产权保护强度测量方法研究述评[J]. 科学学研究, 2014, 32(3): 359-365. |
| [5] | 杨静 朱雪忠. FTA 知识产权保护强度评价体系设计研究与试用[J]. , 2013, (6): 883-891. |
| [6] | 吴凯 蔡虹 赵皎卉. 知识产权保护和贸易对中国经济发展的作用[J]. , 2013, (1): 43-49. |
| [7] | 张江雪. 我国知识产权保护在技术市场中的作用分析[J]. , 2010, 28(12): 1837-1842. |
| [8] | 吴凯;蔡虹;蒋仁爱. 中国知识产权保护与经济增长的实证研究[J]. , 2010, 28(12): 1832-1836. |
| [9] | 姚利民;饶艳. 中国知识产权保护地区差异与技术引进的实证研究[J]. , 2009, 27(8): 1177-1184. |
| [10] | 林承亮;楼慧心;樊丽淑. 传统制造业中的知识产权弱保护状态及其影响——基于长三角地区部分企业的调查分析[J]. , 2008, 26(5): 955-961. |
| [11] | 许春明;单晓光. 中国知识产权保护强度指标体系的构建及验证[J]. , 2008, 26(4): 715-723. |
| 阅读次数 | ||||||
|
全文 |
|
|||||
|
摘要 |
|
|||||
